> ## Documentation Index
> Fetch the complete documentation index at: https://bun.ll1025.cn/llms.txt
> Use this file to discover all available pages before exploring further.
# 基准测试
> 如何对 Bun 进行基准测试
Bun 为速度而生。热路径经过广泛的性能分析和基准测试。所有 Bun 公开基准测试的源代码位于 Bun 仓库的 [`/bench`](https://github.com/oven-sh/bun/tree/main/bench) 目录中。
## 测量时间
为精确测量时间,Bun 提供了两个运行时 API:
1. Web 标准的 [`performance.now()`](https://developer.mozilla.org/en-US/docs/Web/API/Performance/now) 函数
2. `Bun.nanoseconds()`,类似于 `performance.now()`,但返回应用启动以来的纳秒数。使用 `performance.timeOrigin` 可将其转换为 Unix 时间戳。
## 基准测试工具
* 对于微基准测试,我们推荐使用 [`mitata`](https://github.com/evanwashere/mitata)。
* 对于负载测试,你*必须使用*至少与 `Bun.serve()` 一样快的 HTTP 基准测试工具,否则结果会有偏差。一些流行的基于 Node.js 的基准测试工具(如 [`autocannon`](https://github.com/mcollina/autocannon))速度不够快。我们推荐以下之一:
* [`bombardier`](https://github.com/codesenberg/bombardier)
* [`oha`](https://github.com/hatoo/oha)
* [`http_load_test`](https://github.com/uNetworking/uSockets/blob/master/examples/http_load_test.c)
* 对于脚本或 CLI 命令的基准测试,我们推荐使用 [`hyperfine`](https://github.com/sharkdp/hyperfine)。
## 测量内存使用
Bun 有两个堆:一个用于 JavaScript 运行时,另一个用于其他所有内容。
### JavaScript 堆统计
`bun:jsc` 模块提供了几个用于测量内存使用情况的函数:
```ts theme={null}
import { heapStats } from "bun:jsc";
console.log(heapStats());
```
```ts expandable icon="https://mintcdn.com/span-inc/82N53aP7NFbaCVSl/icons/typescript.svg?fit=max&auto=format&n=82N53aP7NFbaCVSl&q=85&s=787d39d6a7d96d7f9540dc74344eba23" theme={null}
{
heapSize: 1657575,
heapCapacity: 2872775,
extraMemorySize: 598199,
objectCount: 13790,
protectedObjectCount: 62,
globalObjectCount: 1,
protectedGlobalObjectCount: 1,
// 堆中每种对象类型的计数
objectTypeCounts: {
CallbackObject: 25,
FunctionExecutable: 2078,
AsyncGeneratorFunction: 2,
'RegExp String Iterator': 1,
FunctionCodeBlock: 188,
ModuleProgramExecutable: 13,
String: 1,
UnlinkedModuleProgramCodeBlock: 13,
JSON: 1,
AsyncGenerator: 1,
Symbol: 1,
GetterSetter: 68,
ImportMeta: 10,
DOMAttributeGetterSetter: 1,
UnlinkedFunctionCodeBlock: 174,
RegExp: 52,
ModuleLoader: 1,
Intl: 1,
WeakMap: 4,
Generator: 2,
PropertyTable: 95,
'Array Iterator': 1,
JSLexicalEnvironment: 75,
UnlinkedFunctionExecutable: 2067,
WeakSet: 1,
console: 1,
Map: 23,
SparseArrayValueMap: 14,
StructureChain: 19,
Set: 18,
'String Iterator': 1,
FunctionRareData: 3,
JSGlobalLexicalEnvironment: 1,
Object: 481,
BigInt: 2,
StructureRareData: 55,
Array: 179,
AbortController: 2,
ModuleNamespaceObject: 11,
ShadowRealm: 1,
'Immutable Butterfly': 103,
Primordials: 1,
'Set Iterator': 1,
JSGlobalProxy: 1,
AsyncFromSyncIterator: 1,
ModuleRecord: 13,
FinalizationRegistry: 1,
AsyncIterator: 1,
InternalPromise: 22,
Iterator: 1,
CustomGetterSetter: 65,
Promise: 19,
WeakRef: 1,
InternalPromisePrototype: 1,
Function: 2381,
AsyncFunction: 2,
GlobalObject: 1,
ArrayBuffer: 2,
Boolean: 1,
Math: 1,
CallbackConstructor: 1,
Error: 2,
JSModuleEnvironment: 13,
WebAssembly: 1,
HashMapBucket: 300,
Callee: 3,
symbol: 37,
string: 2484,
Performance: 1,
ModuleProgramCodeBlock: 12,
JSSourceCode: 13,
JSPropertyNameEnumerator: 3,
NativeExecutable: 290,
Number: 1,
Structure: 1550,
SymbolTable: 108,
GeneratorFunction: 2,
'Map Iterator': 1
},
protectedObjectTypeCounts: {
CallbackConstructor: 1,
BigInt: 1,
RegExp: 2,
GlobalObject: 1,
UnlinkedModuleProgramCodeBlock: 13,
HashMapBucket: 2,
Structure: 41,
JSPropertyNameEnumerator: 1
}
}
```
JavaScript 是一种垃圾回收语言,不是引用计数语言。对象并非在所有情况下都能立即释放,这是正常且正确的,但对象永远不被释放则是不正常的。
强制手动运行垃圾回收:
```ts theme={null}
Bun.gc(true); // 同步
Bun.gc(false); // 异步
```
堆快照可以显示哪些对象未被释放。使用 `Bun.generateHeapSnapshot()` 获取堆快照,然后使用 Safari 或 WebKit GTK 开发者工具查看。生成堆快照:
```ts theme={null}
import { generateHeapSnapshot } from "bun";
const snapshot = generateHeapSnapshot();
await Bun.write("heap.json", JSON.stringify(snapshot, null, 2));
```
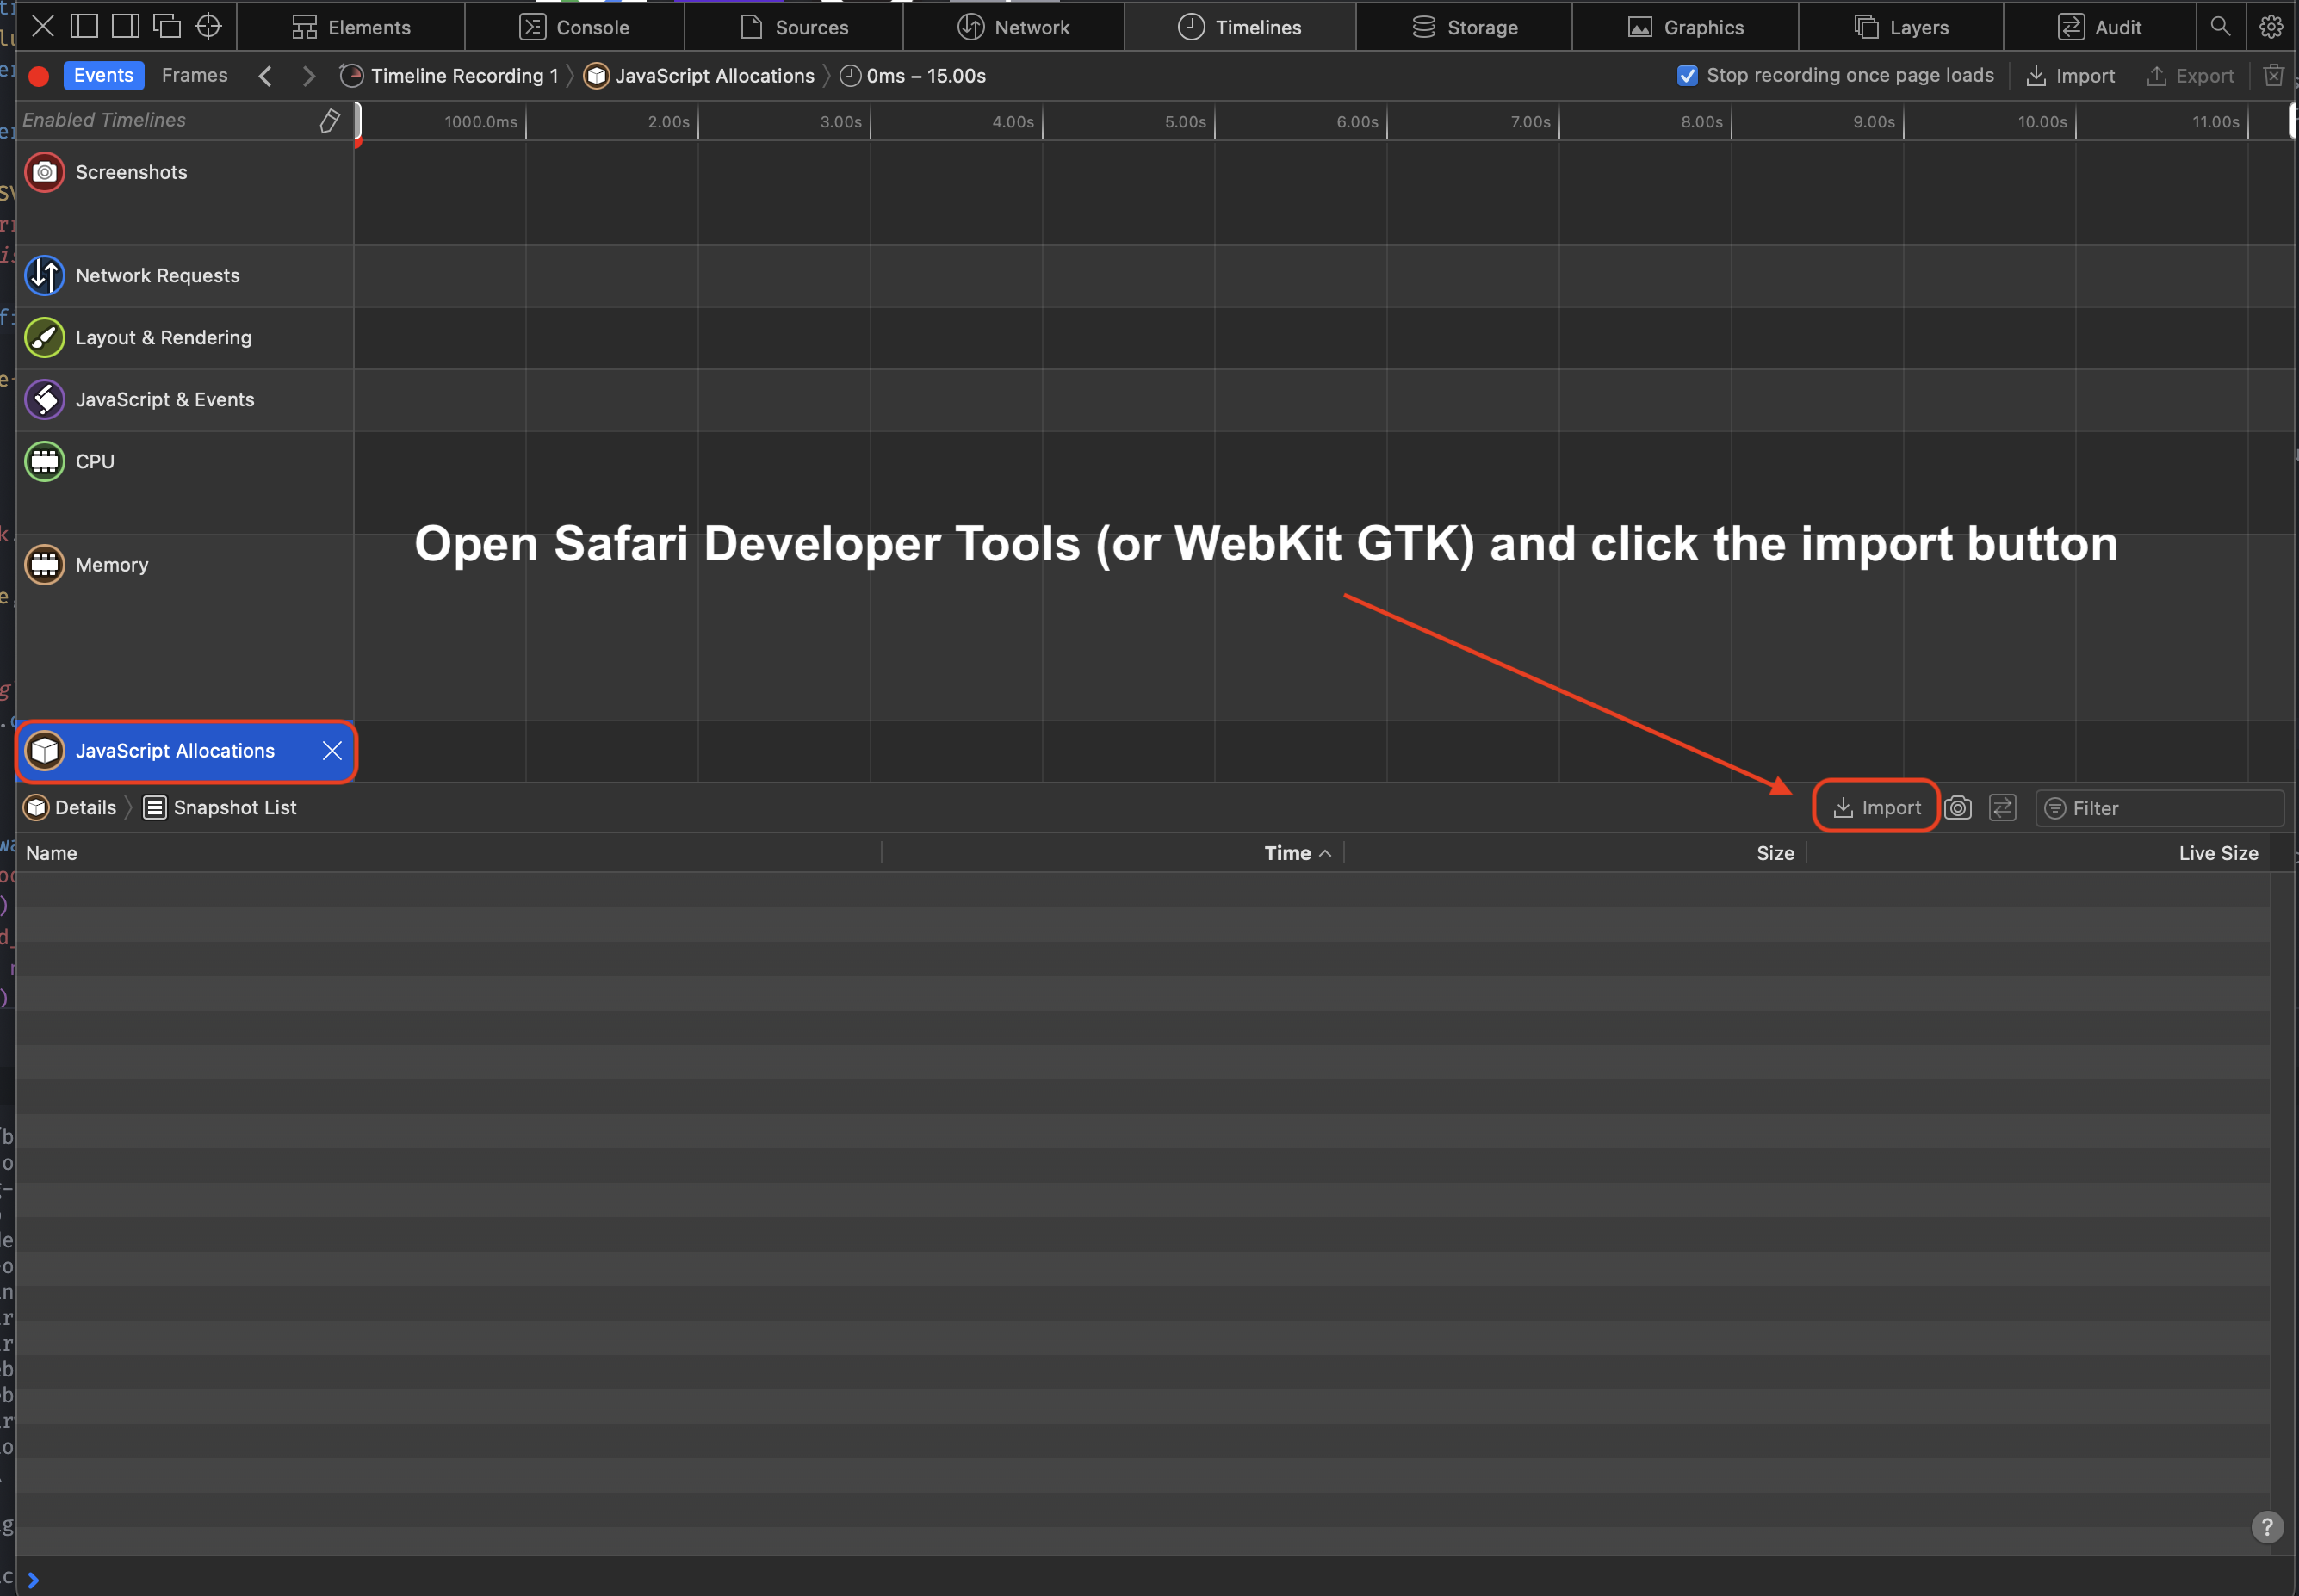
要查看快照,在 Safari 的开发者工具(或 WebKit GTK)中打开 `heap.json` 文件:
1. 打开开发者工具
2. 点击"Timeline"
3. 点击左侧菜单中的"JavaScript Allocations"。可能需要点击铅笔图标显示所有时间线才能看到
4. 点击"Import"并选择你的堆快照 JSON
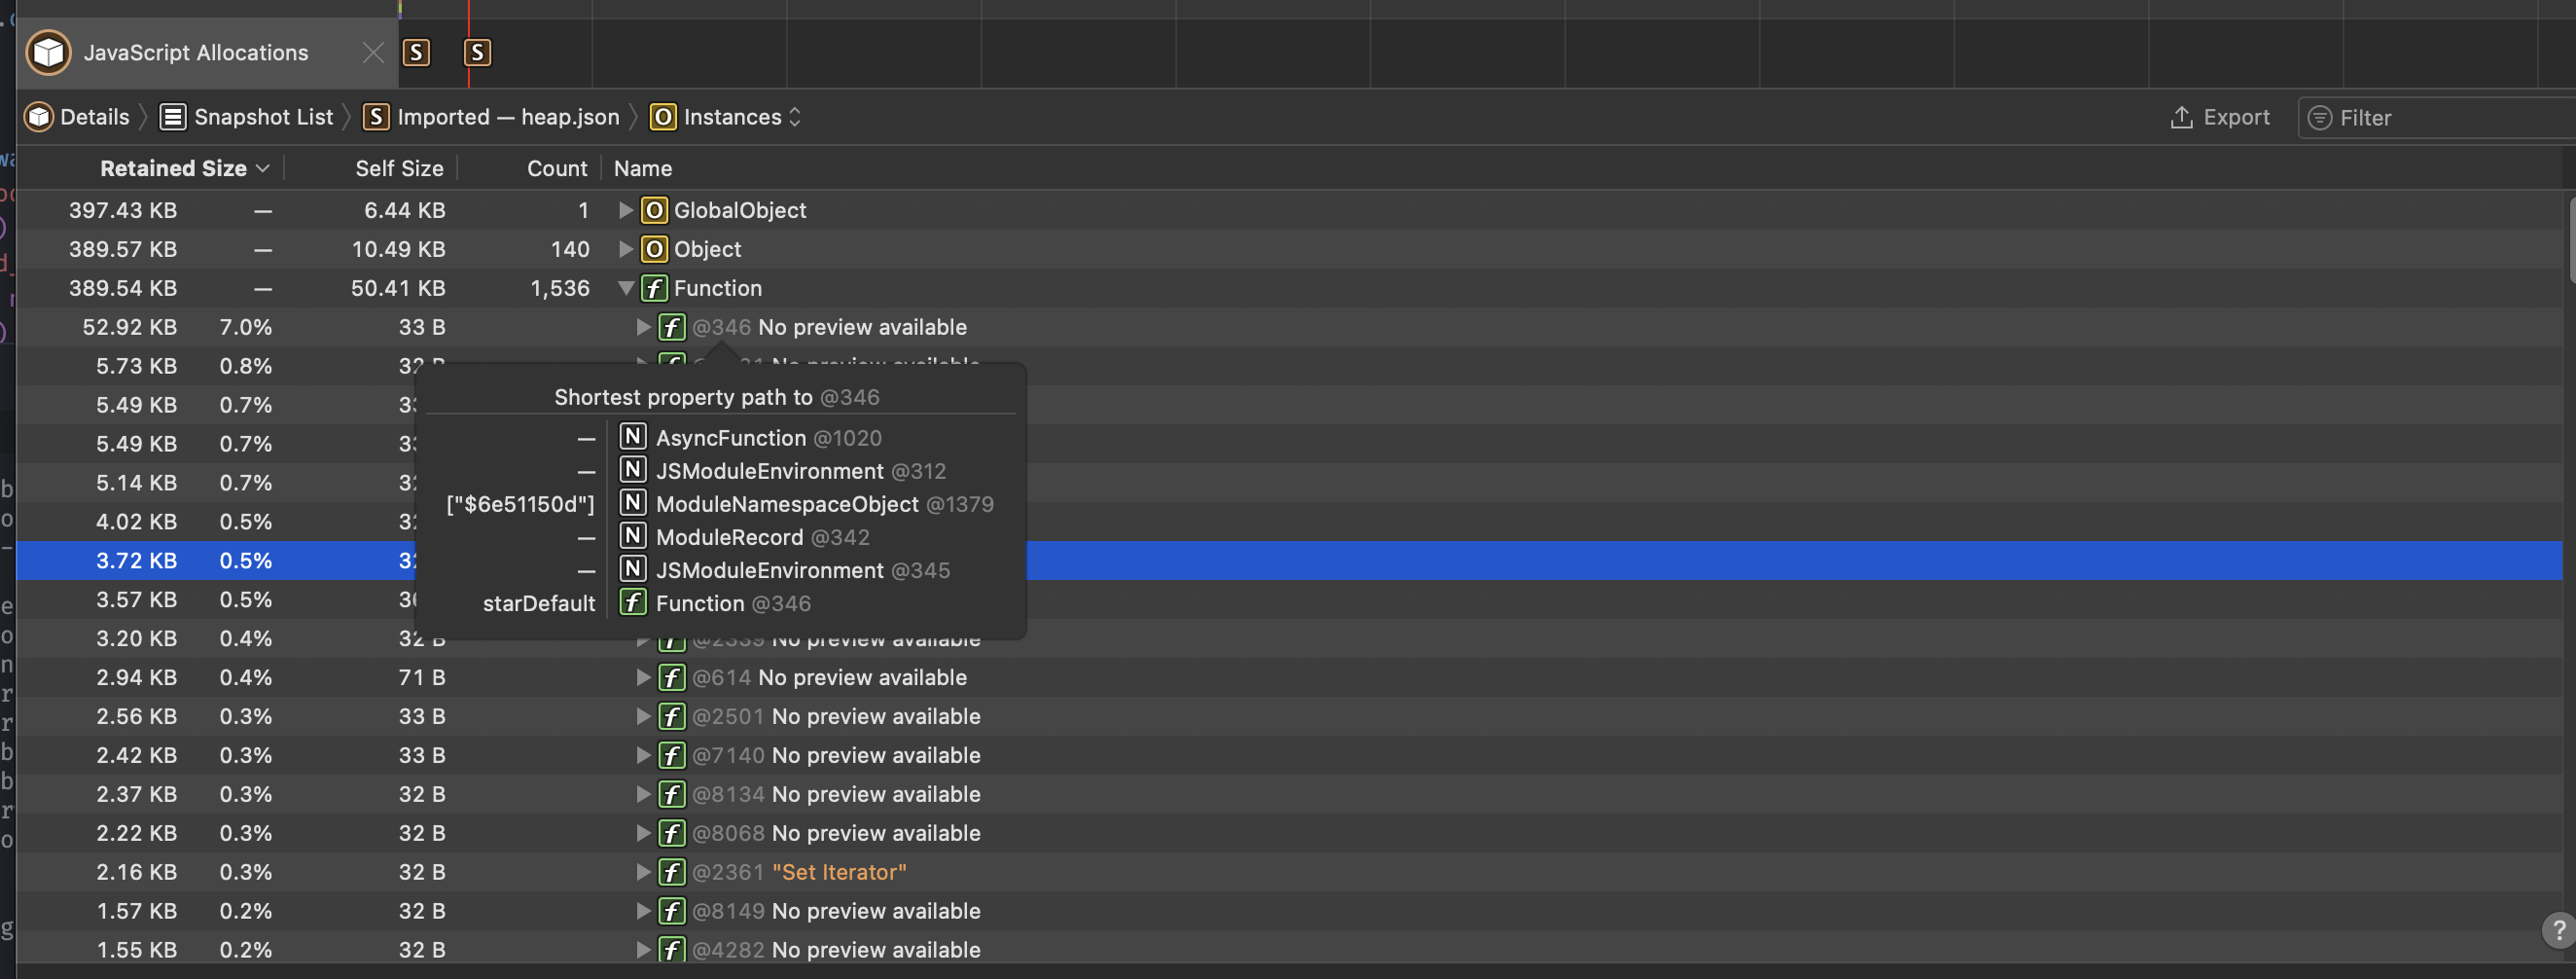
 导入后,你应该会看到类似这样的内容:
 > [Web 调试器](/runtime/debugger#inspect)的时间线也会跟踪正在调试会话的内存使用情况。
### 原生堆统计
Bun 对另一个堆使用 mimalloc。要打印非 JavaScript 内存使用摘要,调用 `Bun.unsafe.mimallocDump()`。
```ts theme={null}
Bun.unsafe.mimallocDump();
```
```txt theme={null}
heap stats: peak total freed current unit count
reserved: 64.0 MiB 64.0 MiB 0 64.0 MiB not all freed!
committed: 64.0 MiB 64.0 MiB 0 64.0 MiB not all freed!
reset: 0 0 0 0 ok
touched: 128.5 KiB 128.5 KiB 5.4 MiB -5.3 MiB ok
segments: 1 1 0 1 not all freed!
-abandoned: 0 0 0 0 ok
-cached: 0 0 0 0 ok
pages: 0 0 53 -53 ok
-abandoned: 0 0 0 0 ok
-extended: 0
-noretire: 0
mmaps: 0
commits: 0
threads: 0 0 0 0 ok
searches: 0.0 avg
numa nodes: 1
elapsed: 0.068 s
process: user: 0.061 s, system: 0.014 s, faults: 0, rss: 57.4 MiB, commit: 64.0 MiB
```
## CPU 性能分析
使用 `--cpu-prof` 标志分析 JavaScript 执行以识别性能瓶颈。
```sh terminal icon="terminal" theme={null}
bun --cpu-prof script.js
```
`--cpu-prof` 会写入一个 `.cpuprofile` 文件,你可以在 Chrome DevTools(Performance 标签 → Load profile)或 VS Code 的 CPU 分析器中打开。
### Markdown 输出
使用 `--cpu-prof-md` 生成 markdown 格式的 CPU 分析文件,便于 grep 和 LLM 分析:
```sh terminal icon="terminal" theme={null}
bun --cpu-prof-md script.js
```
同时使用 `--cpu-prof` 和 `--cpu-prof-md` 可一次生成两种格式:
```sh terminal icon="terminal" theme={null}
bun --cpu-prof --cpu-prof-md script.js
```
你也可以通过 `BUN_OPTIONS` 环境变量传递该标志:
```sh terminal icon="terminal" theme={null}
BUN_OPTIONS="--cpu-prof-md" bun script.js
```
### 选项
```sh terminal icon="terminal" theme={null}
bun --cpu-prof --cpu-prof-name my-profile.cpuprofile script.js
bun --cpu-prof --cpu-prof-dir ./profiles script.js
```
| 标志 | 描述 |
| ---------------------------- | -------------------------------------------- |
| `--cpu-prof` | 生成 `.cpuprofile` JSON 文件(Chrome DevTools 格式) |
| `--cpu-prof-md` | 生成 markdown CPU 分析文件(便于 grep/LLM) |
| `--cpu-prof-name ` | 设置输出文件名 |
| `--cpu-prof-dir ` | 设置输出目录 |
## 堆分析
在退出时生成堆快照以分析内存使用并查找内存泄漏。
```sh terminal icon="terminal" theme={null}
bun --heap-prof script.js
```
`--heap-prof` 会写入一个 V8 `.heapsnapshot` 文件,你可以在 Chrome DevTools(Memory 标签 → Load)中加载。
### Markdown 输出
使用 `--heap-prof-md` 生成 markdown 格式的堆分析文件,适用于 CLI 分析:
```sh terminal icon="terminal" theme={null}
bun --heap-prof-md script.js
```
如果同时指定了 `--heap-prof` 和 `--heap-prof-md`,则使用 markdown 格式。
### 选项
```sh terminal icon="terminal" theme={null}
bun --heap-prof --heap-prof-name my-snapshot.heapsnapshot script.js
bun --heap-prof --heap-prof-dir ./profiles script.js
```
| 标志 | 描述 |
| ----------------------------- | --------------------------- |
| `--heap-prof` | 退出时生成 V8 `.heapsnapshot` 文件 |
| `--heap-prof-md` | 退出时生成 markdown 堆分析文件 |
| `--heap-prof-name ` | 设置输出文件名 |
| `--heap-prof-dir ` | 设置输出目录 |
> [Web 调试器](/runtime/debugger#inspect)的时间线也会跟踪正在调试会话的内存使用情况。
### 原生堆统计
Bun 对另一个堆使用 mimalloc。要打印非 JavaScript 内存使用摘要,调用 `Bun.unsafe.mimallocDump()`。
```ts theme={null}
Bun.unsafe.mimallocDump();
```
```txt theme={null}
heap stats: peak total freed current unit count
reserved: 64.0 MiB 64.0 MiB 0 64.0 MiB not all freed!
committed: 64.0 MiB 64.0 MiB 0 64.0 MiB not all freed!
reset: 0 0 0 0 ok
touched: 128.5 KiB 128.5 KiB 5.4 MiB -5.3 MiB ok
segments: 1 1 0 1 not all freed!
-abandoned: 0 0 0 0 ok
-cached: 0 0 0 0 ok
pages: 0 0 53 -53 ok
-abandoned: 0 0 0 0 ok
-extended: 0
-noretire: 0
mmaps: 0
commits: 0
threads: 0 0 0 0 ok
searches: 0.0 avg
numa nodes: 1
elapsed: 0.068 s
process: user: 0.061 s, system: 0.014 s, faults: 0, rss: 57.4 MiB, commit: 64.0 MiB
```
## CPU 性能分析
使用 `--cpu-prof` 标志分析 JavaScript 执行以识别性能瓶颈。
```sh terminal icon="terminal" theme={null}
bun --cpu-prof script.js
```
`--cpu-prof` 会写入一个 `.cpuprofile` 文件,你可以在 Chrome DevTools(Performance 标签 → Load profile)或 VS Code 的 CPU 分析器中打开。
### Markdown 输出
使用 `--cpu-prof-md` 生成 markdown 格式的 CPU 分析文件,便于 grep 和 LLM 分析:
```sh terminal icon="terminal" theme={null}
bun --cpu-prof-md script.js
```
同时使用 `--cpu-prof` 和 `--cpu-prof-md` 可一次生成两种格式:
```sh terminal icon="terminal" theme={null}
bun --cpu-prof --cpu-prof-md script.js
```
你也可以通过 `BUN_OPTIONS` 环境变量传递该标志:
```sh terminal icon="terminal" theme={null}
BUN_OPTIONS="--cpu-prof-md" bun script.js
```
### 选项
```sh terminal icon="terminal" theme={null}
bun --cpu-prof --cpu-prof-name my-profile.cpuprofile script.js
bun --cpu-prof --cpu-prof-dir ./profiles script.js
```
| 标志 | 描述 |
| ---------------------------- | -------------------------------------------- |
| `--cpu-prof` | 生成 `.cpuprofile` JSON 文件(Chrome DevTools 格式) |
| `--cpu-prof-md` | 生成 markdown CPU 分析文件(便于 grep/LLM) |
| `--cpu-prof-name ` | 设置输出文件名 |
| `--cpu-prof-dir ` | 设置输出目录 |
## 堆分析
在退出时生成堆快照以分析内存使用并查找内存泄漏。
```sh terminal icon="terminal" theme={null}
bun --heap-prof script.js
```
`--heap-prof` 会写入一个 V8 `.heapsnapshot` 文件,你可以在 Chrome DevTools(Memory 标签 → Load)中加载。
### Markdown 输出
使用 `--heap-prof-md` 生成 markdown 格式的堆分析文件,适用于 CLI 分析:
```sh terminal icon="terminal" theme={null}
bun --heap-prof-md script.js
```
如果同时指定了 `--heap-prof` 和 `--heap-prof-md`,则使用 markdown 格式。
### 选项
```sh terminal icon="terminal" theme={null}
bun --heap-prof --heap-prof-name my-snapshot.heapsnapshot script.js
bun --heap-prof --heap-prof-dir ./profiles script.js
```
| 标志 | 描述 |
| ----------------------------- | --------------------------- |
| `--heap-prof` | 退出时生成 V8 `.heapsnapshot` 文件 |
| `--heap-prof-md` | 退出时生成 markdown 堆分析文件 |
| `--heap-prof-name ` | 设置输出文件名 |
| `--heap-prof-dir ` | 设置输出目录 |